
Each system has its own dashboard displaying relevant information, sensor values, call control, call history, and much more.
Page actions
| Page actions | |
|---|---|
| Allows you to edit the system. | |
| 1. Page refresh (
) allows you to manually refresh the dashboard 2. Access relevant documentation ( ) |
Control bars
Quick control bar

| Option | Description |
|---|---|
| Enter or search for an address to call. | |
| Click to call the entered address. | |
| Toggle mute. | |
| Set the volume on the system. | |
| Restart the system. |
In call control bar
This bar is only displayed when the system is in a call.

| Option | Description |
|---|---|
| Hang up the current call. | |
| Send DTMF signals. |
In meeting control bar
This bar is only displayed when the system is in a meeting within Mividas.

| Option | Description |
|---|---|
| Takes you to the scheduled meeting it is a part of. |
Widgets and lists
Widgets
| Widget | Description |
|---|---|
| SIP | The SIP address of the system. |
| E-mail address | The e-mail address of the system. |
| Device type | The device type and IP address of the system. Clicking the IP address takes you to the system’s Web GUI. |
 | Displays the last time the system was online and the last time an event was triggered. |
 | Displays the system’s uptime and the last time it was updated. |
 | Displays the date and time of the system’s next upcoming meeting and the total number of upcoming meetings. |
 | Displays the system’s temperature in Celsius and Farenheit. |
 | Displays the system’s air quality and humidity. |
 | Displays the system’s Ambient noise and Noise. |
 | Displays the number of people in the room and its total number of seats. |
 | Displays the total number of connected peripherals and the total number of video outputs. |
 | Displays the system’s notifications. |
System information

This list displays various information about the system and varies depending on its settings. The following information can be displayed: Name, Organization, Location, Connection, Dial-in protocol, Standard type of scheduling from portal, System has active macros, HTTP/HTTPS mode.

- Type – Displays the severity of the alert:
- – Indicates a severe failure that requires immediate attention. The system might be unusable or crashing.
- – Signals that the system might not operate fully, immediate action might be required, but the system can still run.
- – Something unexpected happened, or a potential issue was detected. The system is working, but attention is needed.
- – Normal operational messages that indicate system status or changes. No action required, just for tracking purposes.
- – Debug. Debug level will probably never be enabled by the remote systems but the option is left if that would change.
- – Mividas Rooms is unable to determine the severity level of the notification.
- Details – Displays the error message.
| Option | Description |
|---|---|
| Hides and acknowledges the alert for the system until it is triggered again. | |
| Takes you to Monitoring with this system applied as a filter. |

This list displays technical information about the system: Type, Model, MAC address, Serial, Firmware.
Room usage
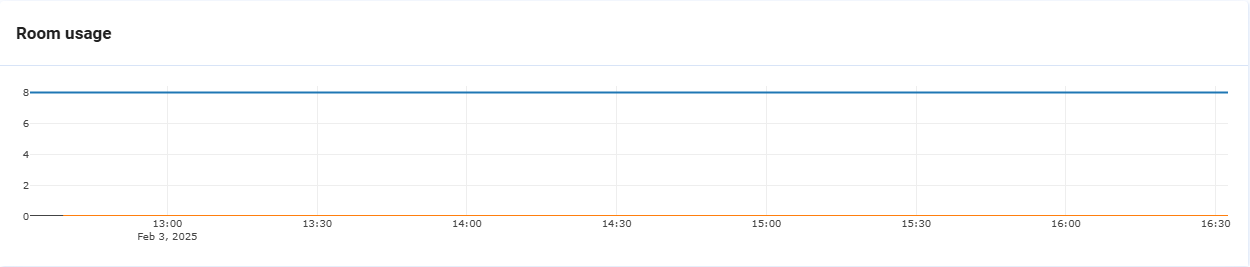
This graph displays the number of seats in the room and the number of people in that room.
(
) – Shows the total number of seats in the room.
(
) – Shows the total number of people in the room at the time.
Peripherals

This list displays all peripherals connected to the system. Clicking expands that peripheral with details.
Example: Cisco Room Navigator

- Network address – Displays the Cisco Room Navigator’s IP address.
- Serial number – Displays the Cisco Room Navigator’s serial number.
- Firmware – Displays the Cisco Room Navigator’s current firmware version.
- Status – Displays the current status of the Cisco Room Navigator.
Example: Samsung TV

- Monitor role – Displays the monitor’s role;
First,Second. - Screen size – Displays the monitor’s screen size. E.g.
43. - Preferred format – Displays the monitor’s preferred format. E.g.
3840x2160@30Hz. - Serial number – Displays the monitor’s serial number. E.g.
12345678. - Model – Displays the monitor’s model.
- Manufacturer – Displays the monitor’s manufacturer.
Call history
To retrieve call history, click .

When you hover one of the calls, two buttons appear.
| Option | Description |
|---|---|
| Opens details about the call. | |
| Call the address. |
Upcoming meetings

When you hover the upcoming meeting, a button appears.
| Option | Description |
|---|---|
| Takes you to the scheduled meeting. | |
| Takes you to Scheduled meetings with this system applied as a filter. |